The Psychology of the Pump: When gas approaches $4/gallon, consumer sentiment crashes and discretionary spending collapses. Your attribution model is blind to the shift. Here is the causal chain from the gas pump to your checkout page.
Read the full article below for detailed insights and actionable strategies.
The numbers behind the problem
Avg ad spend wasted
Meta ROAS inflation
Cost to find out
Setup time
When the national average for a gallon of gas approaches $4.00, something breaks in the American consumer's brain. It is not just a financial calculation; it is a psychological trigger. The numbers flashing on the gas station marquee act as a daily, highly visible index of macroeconomic distress.
Right now, as the geopolitical fallout from the US-Israel conflict with Iran sends crude oil prices soaring, that distress is manifesting directly in your Shopify analytics.
This article maps the causal chain from a Middle Eastern conflict to a sudden, unexplained drop in your e-commerce conversion rates, and explains why your current attribution model is completely blind to the shift.
The Causal Chain: From the Pump to the Cart
The connection between global oil markets and a consumer abandoning a pair of $80 sweatpants in an online checkout is a masterclass in behavioral economics.
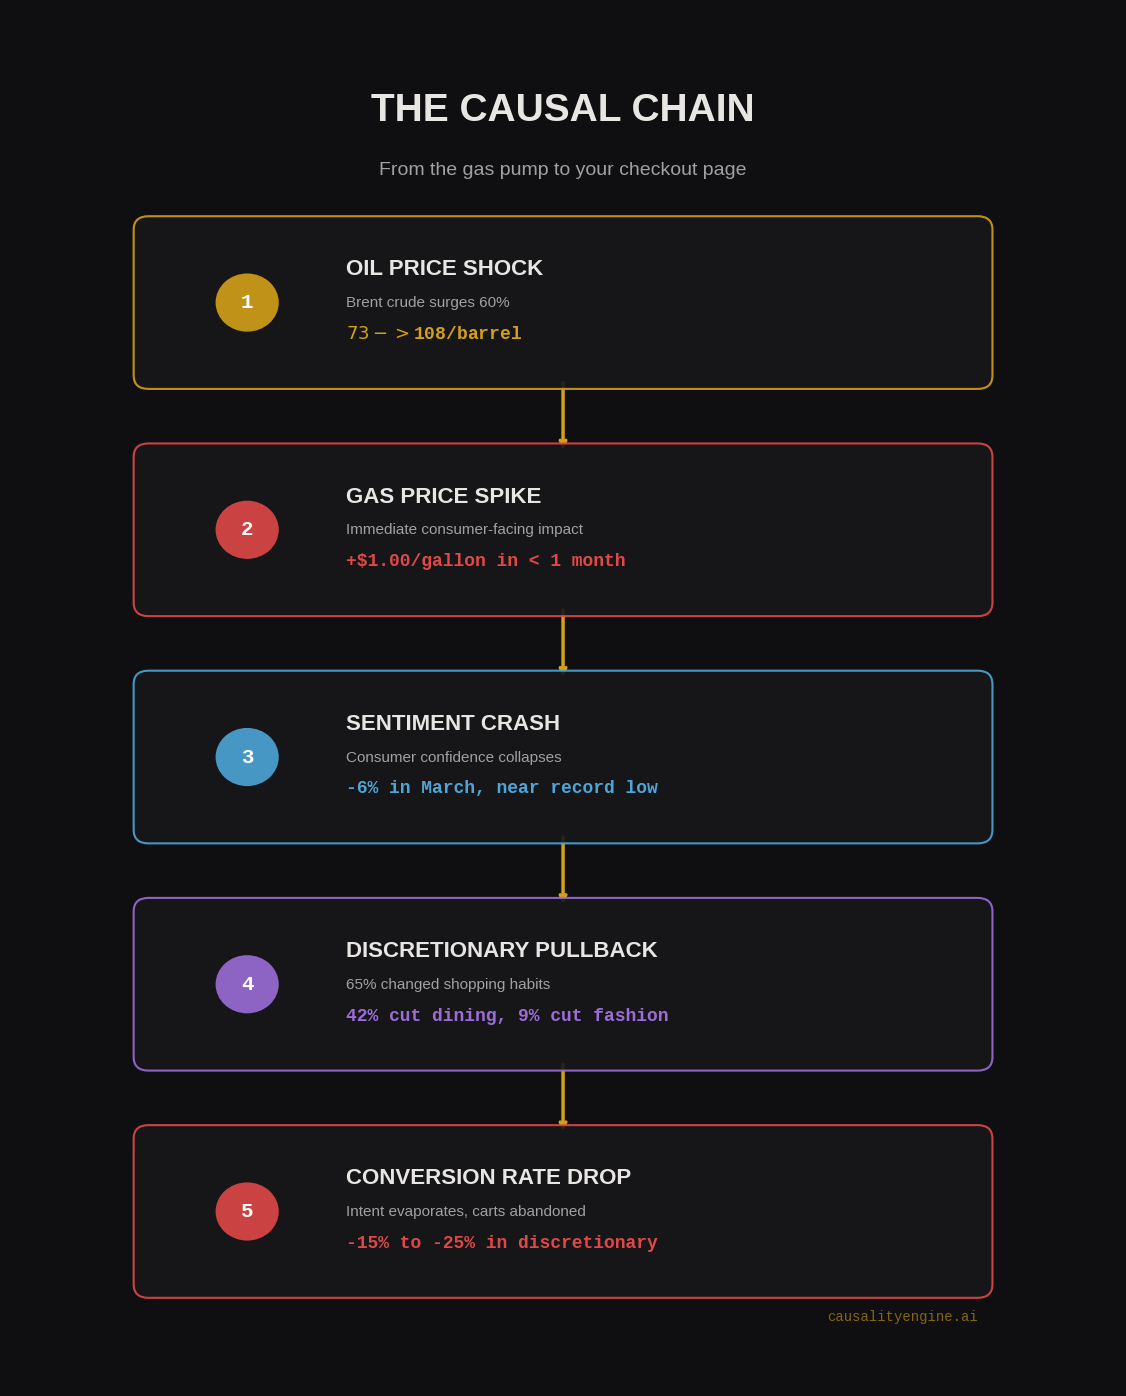
1. The Oil Shock Hits the Pump
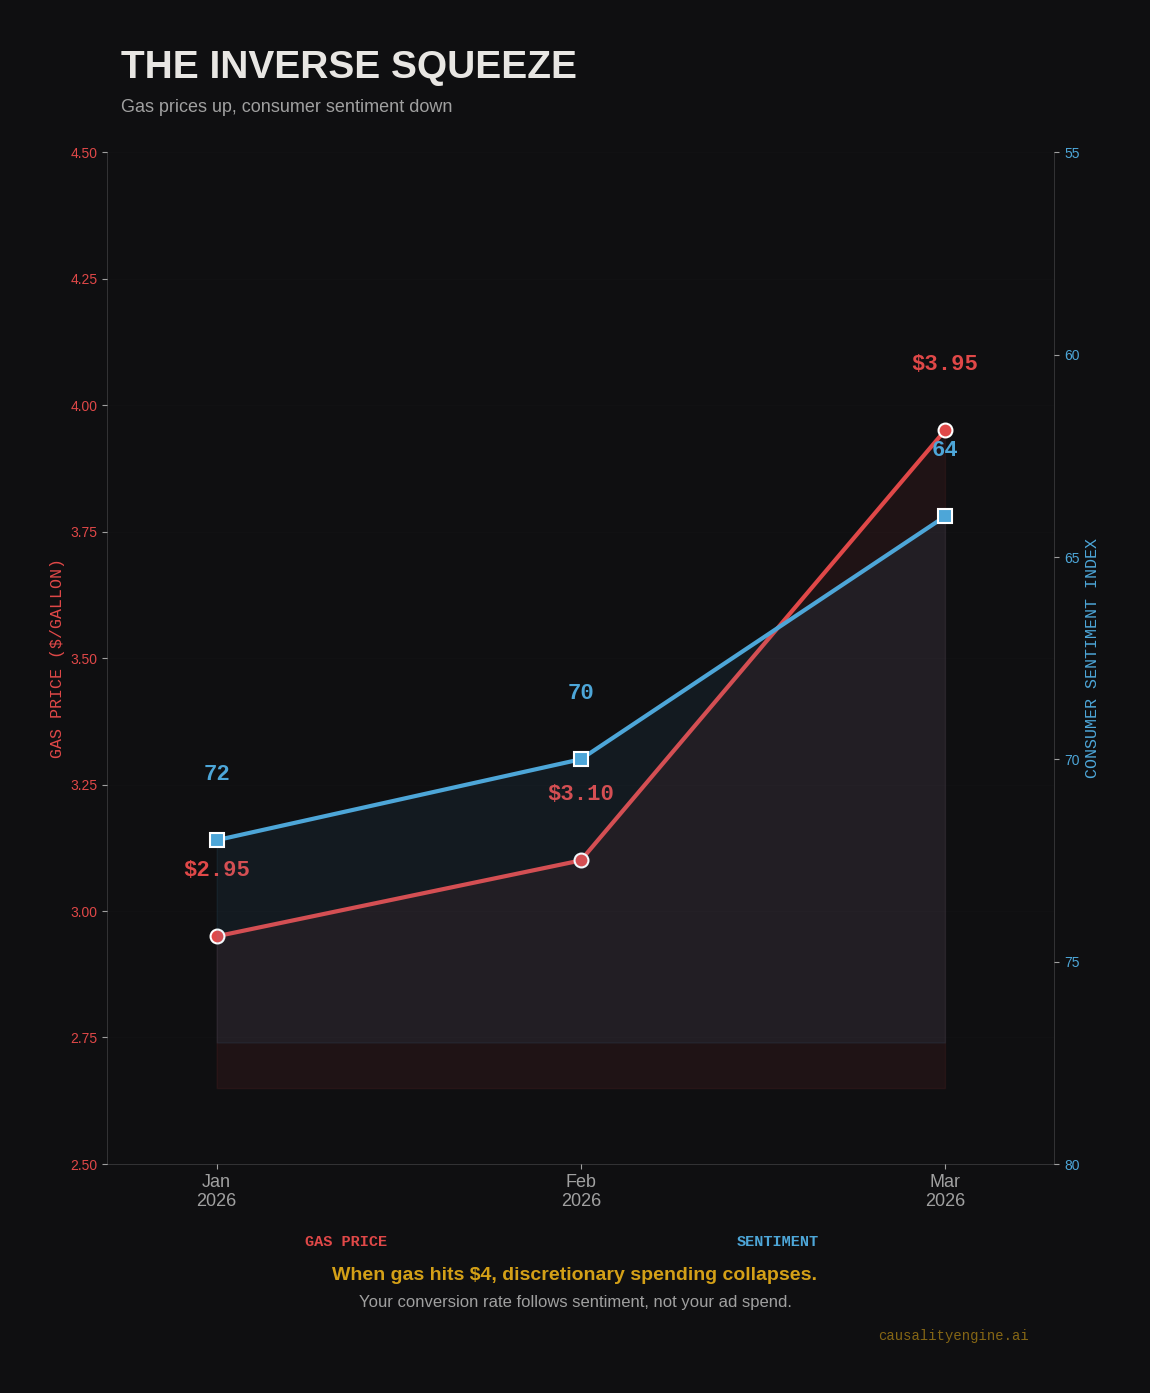
The conflict in the Middle East drove Brent crude from ~$73 per barrel to over $100 in a matter of weeks [1]. Unlike corporate supply chain costs, which take months to trickle down to consumers, oil shocks hit the gas pump almost immediately. In less than a month, the national average for gasoline jumped by approximately $1.00 per gallon [2].
2. The Sentiment Crash
Gas prices have an outsized impact on consumer sentiment, far exceeding their actual share of household budgets. When gas prices spike, sentiment plummets. In March 2026, consumer sentiment fell by 6%, nearing record lows [3]. The University of Michigan's sentiment index showed broad-based declines across all demographics.
The consumer is spooked. And a spooked consumer changes their behavior instantly.
3. The Discretionary Pullback
When sentiment drops, the first casualty is discretionary spending. A recent Omnisend survey revealed that a staggering 65% of consumers have already changed their shopping habits in response to the current economic climate, with another 18% planning to do so [4].
The cutbacks are severe and targeted: 42% are reducing dining out, 18% are cutting travel, and 9% are pulling back on entertainment and fashion [4].
If you sell apparel, home goods, or mid-market luxury items, your target audience just actively decided to buy less of what you sell.
_8e7f1a1f.png)
4. The Conversion Rate Collapse
This macroeconomic pullback shows up in your e-commerce metrics as a sudden, inexplicable drop in conversion rates. Historically, consumer sentiment shocks of this magnitude correlate with 15% to 25% declines in conversion rates for discretionary e-commerce categories.
Traffic remains stable, but the intent to purchase evaporates. Users browse, add to cart, and then abandon. The psychological friction of spending $100 online is too high when it costs $60 just to fill the tank to get to work.
The Retargeting Trap and Platform Blindness
Here is where the macro environment exposes the fatal flaw in platform-reported attribution.
When conversion rates drop across the board, the most severe impact is often seen in your "warm" audiences. The people who visited your site last week when gas was $3.00 a gallon are now being retargeted with ads when gas is $4.00 a gallon. Their intent has changed, but your advertising platform does not know that.
Meta and Google operate on historical lookback windows (typically 7 to 28 days). They assume that a user who showed interest last week is still a high-probability buyer today. They continue to aggressively bid for these users, driving up your CPMs precisely when the users' likelihood to convert has plummeted.
The platform dashboard will show your Return on Ad Spend (ROAS) slowly degrading, but it will not tell you why. It will encourage you to "improve your creative" or "broaden your audience." It cannot tell you that the fundamental psychology of your buyer has shifted.
The Causal Imperative
You cannot fix a macroeconomic sentiment shock with a better ad creative.
When the market shifts this violently, you need measurement that adapts in real-time. Correlational attribution looks backward; it relies on historical patterns that are no longer valid.
Causal inference measurement looks at what is happening right now. It isolates the true incremental lift of your marketing spend against a control group that is experiencing the exact same macroeconomic conditions.
If consumer sentiment is suppressing baseline conversion rates, causal measurement will reveal which campaigns are actually overcoming that friction and driving net-new sales, and which campaigns are just burning budget on users who have already decided to close their wallets.
In a volatile economy, the gap between platform-reported ROAS and true incremental ROAS widens dramatically. The brands that survive the current oil shock will be the ones who stop looking at the gas pump, stop trusting the platform dashboards, and start measuring the causal truth.
Stop guessing, start knowing.
References
[1] Fortune. (2026). Current price of oil as of March 27, 2026.
[2] Stanford Institute for Economic Policy Research. (2026). Projected household gas spending increase.
[3] Investopedia. (2026). The Iran war is crushing consumer sentiment.
[4] Omnisend. (2026). Consumer behavior shift survey data.
Get attribution insights in your inbox
One email per week. No spam. Unsubscribe anytime.
Key Terms in This Article
Attribution
Attribution identifies user actions that contribute to a desired outcome and assigns value to each. It reveals which marketing touchpoints drive conversions.
Causal Chain
A Causal Chain is a sequence of events where each event causes the next, leading from an initial cause to a final effect.
Causal Inference
Causal Inference determines the independent, actual effect of a phenomenon within a system, identifying true cause-and-effect relationships.
Control Group
Control Group is a segment of an audience intentionally not exposed to a marketing campaign, used to measure the campaign's true causal impact.
Conversion rate
Conversion Rate is the percentage of website visitors who complete a desired action out of the total number of visitors.
Incrementality
Incrementality measures the true causal impact of a marketing campaign. It quantifies the additional conversions or revenue directly from that activity.
Return on Ad Spend (ROAS)
Return on Ad Spend (ROAS) measures the revenue earned for every dollar spent on advertising. It indicates the profitability of advertising campaigns.
Target Audience
A target audience is a specific group of consumers identified as the intended recipients of a marketing message or campaign.
Related Articles
Ready to see your real numbers?
Upload your GA4 data. See which channels drive incremental sales. Confidence-scored results in minutes.
Book a DemoFull refund if you don't see it.
Stay ahead of the attribution curve
Weekly insights on marketing attribution, incrementality testing, and data-driven growth. Written for marketers who care about real numbers, not vanity metrics.
No spam. Unsubscribe anytime. We respect your data.
Frequently Asked Questions
How do gas prices affect e-commerce conversion rates?
When gas prices spike toward 4/gallon, consumer sentiment crashes and discretionary spending contracts. 65% of consumers report changing shopping habits, with 42% cutting dining out and 9% pulling back on fashion.
Why is platform-reported ROAS unreliable during a gas price shock?
Meta and Google use historical lookback windows (7-28 days) that assume past interest predicts future purchases. When gas prices shift consumer psychology overnight, platforms continue bidding aggressively for users whose intent has evaporated. They report degrading ROAS but cannot diagnose the macroeconomic cause.
What is the causal chain from oil prices to cart abandonment?
The chain runs: (1) Oil price shock hits the pump immediately, (2) Consumer sentiment crashes (down 6% in March 2026), (3) Discretionary spending pulls back (65% changed habits), (4) Conversion rates collapse (15-25% in discretionary categories), (5) Attribution models fail to detect the macro cause.
How does causal inference help during macroeconomic volatility?
Causal inference isolates the true incremental lift of marketing spend against a control group experiencing the same macroeconomic conditions. It reveals which campaigns genuinely overcome sentiment friction and drive net-new sales, versus which campaigns are burning budget on users who have already decided to close their wallets.
What consumer spending categories are most affected by gas price spikes?
Discretionary categories take the hardest hit. Omnisend data shows 42% of consumers cut dining out, 18% cut travel, and 9% pulled back on entertainment and fashion. Apparel, home goods, and mid-market luxury items face the steepest conversion rate declines during gas price shocks.