The Mathematics of Survival: The Fed holds at 4.5%. CAC has exploded 233% since 2015. Your break-even LTV:CAC ratio just shifted from 1.5x to 3.2x. If your dashboard says 2.0x, you are liquidating your company in slow motion.
Read the full article below for detailed insights and actionable strategies.
The numbers behind the problem
iOS tracking loss
Google Brand cannibalization
Klaviyo overstatement
TikTok attribution lag
For the better part of a decade, Direct-to-Consumer (DTC) brands operated in a financial distortion field. Money was free, ad inventory was cheap, and growth solved every problem. In 2026, the distortion field has collapsed, and the Federal Reserve just handed e-commerce operators a math problem that most will fail to solve.
The causal chain from macroeconomic policy to your daily Facebook Ads budget is absolute. When the cost of capital rises, the threshold for profitable customer acquisition rises with it. If your attribution model is still pretending it is 2019, your business is already bleeding out.
This article breaks down the direct relationship between interest rates, inventory financing, and the true break-even point for DTC customer acquisition.
The Causal Chain: From Jerome Powell to Your Ads Manager
The macroeconomic shift is not abstract. It dictates the exact multiple of Return on Ad Spend (ROAS) you need to survive.
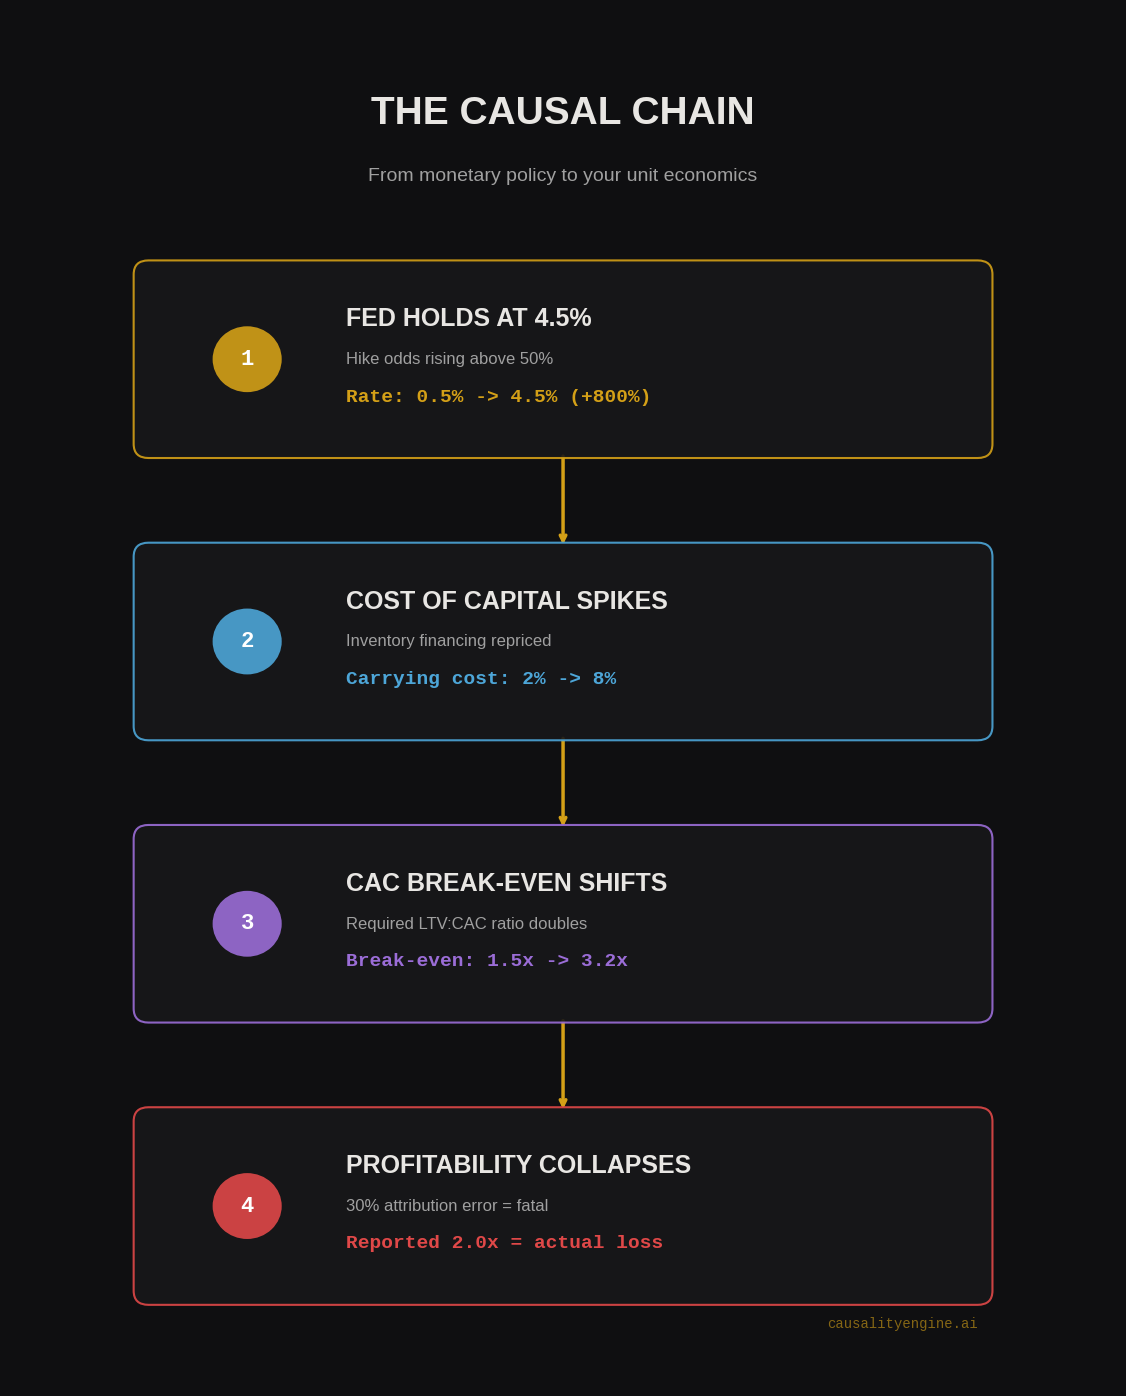
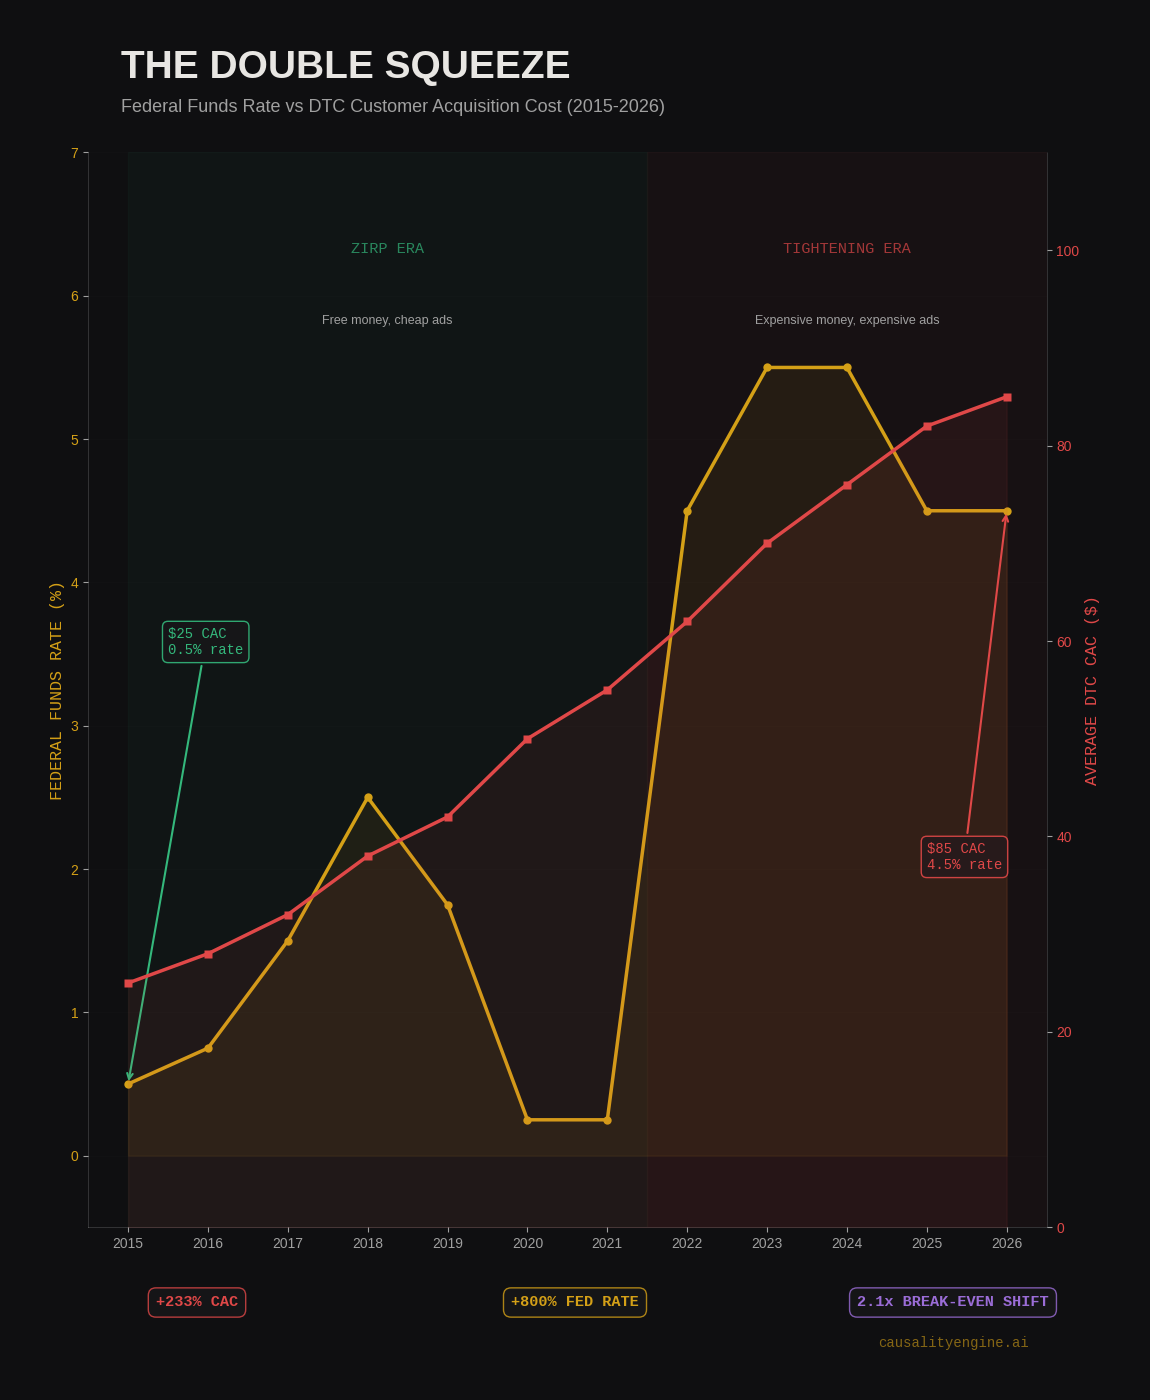
1. The End of Free Money
In 2015, the Federal Funds Rate hovered between 0.25% and 0.50% [1]. Venture capital was abundant, and the cost of capital for a growing DTC brand was functionally zero. Fast forward to March 2026. The Fed has held rates steady at 4.25% to 4.50%, pausing the anticipated rate cuts, while bond traders are now pricing in greater than 50% odds of a rate hike later this year [2]. The era of "higher for longer" is here to stay.
2. The Spike in Inventory Financing
E-commerce is a physical business. You have to buy inventory before you can sell it. In the zero-interest rate era, inventory financing was a minor line item, typically costing 2% to 4%. Today, commercial loans and inventory financing facilities are pricing at Prime plus 2% to 3%, pushing the effective cost of carrying inventory to 8% or even 10% [3].
Every day a product sits in your warehouse, it is actively costing you more money than it did five years ago. This reduces the net present value of your gross margin.
3. The CAC Explosion
While the cost of money was rising, the cost of attention was exploding. In 2015, the average DTC Customer Acquisition Cost (CAC) was between $24 and $28. By 2025, that average had skyrocketed to $82, representing a staggering 233% increase [4].
Brands are paying more than triple to acquire a customer, and they are using money that is three times more expensive to do it.
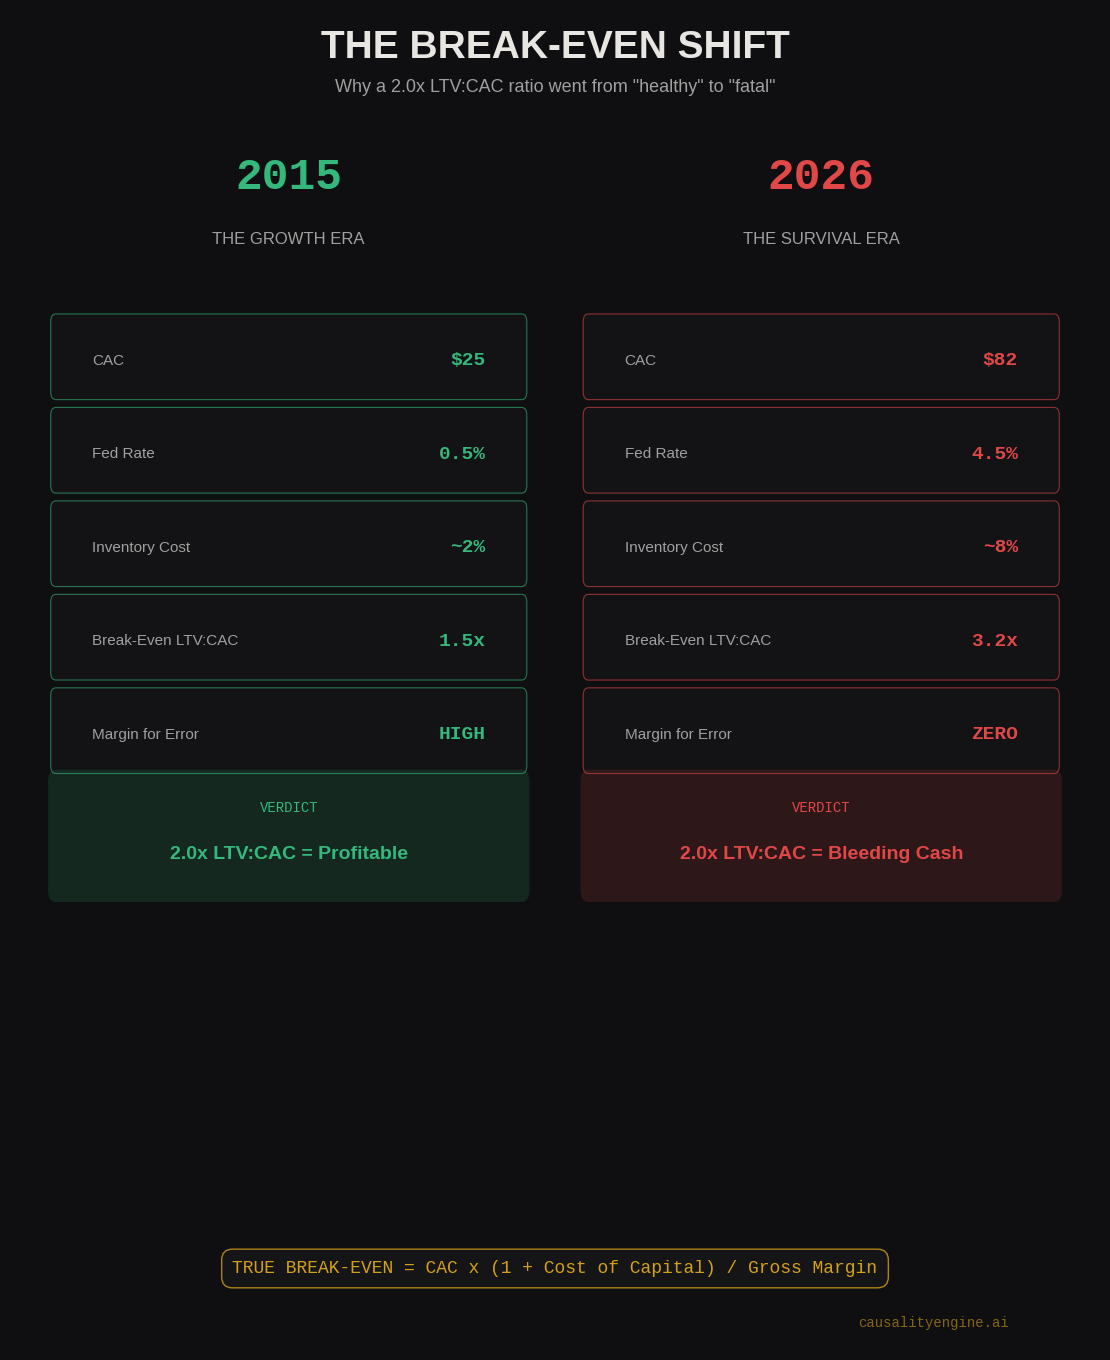
4. The Break-Even Threshold Shift
This convergence of expensive capital and expensive attention fundamentally rewrites the rules of unit economics.
The classic DTC playbook dictated that an LTV:CAC ratio of 3:1 was excellent, and 1.5:1 was acceptable for aggressive growth. That math no longer works.
When you factor in an 8% cost of capital and a $82 CAC, the math shifts dramatically. In 2015, you could acquire a customer for $25, finance the inventory for pennies, and break even on the first purchase. In 2026, you acquire a customer for $82, pay 8% to float the inventory, and your margin is compressed by inflation. Your true break-even LTV:CAC ratio has shifted from 1.5x to closer to 3.2x just to keep the lights on.
If your dashboard says your LTV:CAC is 2.0x, you are not growing. You are liquidating your company in slow motion.
The Attribution Delusion
Here is where the macro environment collides with the reality of marketing operations. If your required break-even threshold has doubled, your measurement accuracy must be flawless.
Yet, most DTC brands are still relying on platform-reported ROAS from Meta, Google, or TikTok. These platforms use correlational attribution models. They look at a user who saw an ad and later bought a product, and they claim 100% of the credit.
They do not ask the only question that matters: "Would this user have bought anyway?"
When money was free, a 30% error rate in your attribution model was a rounding error. You could afford to accidentally pay Meta for organic sales. Today, a 30% error rate is fatal. If your platform reports a $60 CAC, but your true incremental CAC is $90, you are actively violating the new macro-economic break-even threshold on every single transaction.
The Causal Solution
You cannot control the Federal Reserve. You cannot force Meta to lower their CPMs. But you can control what you measure, and therefore, what you fund.
Causal inference is the mathematical antidote to platform bias. It ignores correlational touchpoints and measures the true incremental lift of your marketing spend. It separates the customers who bought because of your ad from the customers who bought despite it.
By deploying causal measurement, you can identify the exact campaigns that are driving net-new, profitable revenue under the new macroeconomic constraints. You stop funding the illusion of growth and start funding actual, incremental cash flow.
In a high-interest rate environment, precision is survival.
Stop reacting to platform dashboards. Start knowing your true numbers.
References
[1] Bankrate. (2026). Fed interest rate history: The federal funds rate from 1981 to the present.
[2] Federal Reserve. (2026). Summary of Economic Projections, March 18, 2026.
[3] FRED. (2026). Selected Interest Rates Instruments, Yields in percent per annum.
[4] Top Growth Marketing. (2026). How to Reduce CAC for DTC Brands.
Get attribution insights in your inbox
One email per week. No spam. Unsubscribe anytime.
Key Terms in This Article
Ad Inventory
Ad Inventory is the total ad space a publisher has available to sell. Understanding ad inventory characteristics helps evaluate ad placement quality and its causal impact on campaign performance.
Causal Chain
A Causal Chain is a sequence of events where each event causes the next, leading from an initial cause to a final effect.
Causal Inference
Causal Inference determines the independent, actual effect of a phenomenon within a system, identifying true cause-and-effect relationships.
Customer acquisition
Customer acquisition attracts new customers to a business. For e-commerce, this means driving the right traffic to the website.
Customer Acquisition Cost (CAC)
Customer Acquisition Cost (CAC) is the cost to convince a consumer to buy a product or service. It measures marketing campaign effectiveness.
Growth Marketing
Growth Marketing is a data-driven marketing approach that uses experimentation to drive sustainable growth across the entire funnel.
Incrementality
Incrementality measures the true causal impact of a marketing campaign. It quantifies the additional conversions or revenue directly from that activity.
Return on Ad Spend (ROAS)
Return on Ad Spend (ROAS) measures the revenue earned for every dollar spent on advertising. It indicates the profitability of advertising campaigns.
Related Articles
Ready to see your real numbers?
Upload your GA4 data. See which channels drive incremental sales. Confidence-scored results in minutes.
Book a DemoFull refund if you don't see it.
Stay ahead of the attribution curve
Weekly insights on marketing attribution, incrementality testing, and data-driven growth. Written for marketers who care about real numbers, not vanity metrics.
No spam. Unsubscribe anytime. We respect your data.
Frequently Asked Questions
How does the Federal Reserve interest rate affect DTC e-commerce profitability?
When the Fed holds rates at 4.5%, the cost of inventory financing jumps from 2% to 8-10%. Combined with a 233% increase in CAC since 2015, the break-even LTV:CAC ratio shifts from 1.5x to 3.2x. A brand reporting 2.0x LTV:CAC is actually losing money on every customer acquired.
What is the true break-even LTV:CAC ratio in 2026?
In 2026, with an 8% cost of capital and $82 average CAC, the true break-even LTV:CAC ratio is approximately 3.2x. The old benchmark of 1.5x was viable only in the zero-interest rate era. The formula: TRUE BREAK-EVEN = CAC x (1 + Cost of Capital) / Gross Margin.
Why is a 30% attribution error rate fatal in 2026?
When the break-even threshold has doubled, measurement accuracy becomes existential. If your platform reports a $60 CAC but your true incremental CAC is $90, you are violating the break-even threshold on every transaction. In the ZIRP era, this error was a rounding error. At 4.5% rates, it is a death sentence.
How much has DTC customer acquisition cost increased since 2015?
Average DTC CAC increased from $24-$28 in 2015 to $82 in 2025, a 233% increase. Simultaneously, the Federal Funds Rate went from 0.5% to 4.5%, an 800% increase. Brands are paying triple for customers using money that costs triple.
How does causal inference fix the LTV:CAC calculation?
Causal inference measures the true incremental lift of marketing spend by separating customers who bought because of an ad from those who would have bought anyway. This reveals the actual incremental CAC, not the platform-inflated number, allowing brands to identify which campaigns genuinely meet the new 3.2x break-even threshold.