The Geopolitics of the Last Mile: Brent crude surged 60% in weeks. USPS announced its first-ever 8% fuel surcharge. A $0.96 shipping increase compresses DTC net margins by 32%. The only variable you control is CAC, and your attribution model is lying about it.
Read the full article below for detailed insights and actionable strategies.
Attribution by the numbers
Avg ad spend wasted
Meta ROAS inflation
Cost to find out
Setup time
The conflict in the Middle East feels distant to most e-commerce operators. It is a macro event discussed on financial networks, tracked by oil traders, and analyzed by foreign policy experts. But for a Direct-to-Consumer (DTC) brand operating on Shopify, the geopolitical shockwaves of the US-Israel war with Iran have already reached your balance sheet.
The causal chain is not theoretical. It is mathematical, immediate, and entirely visible in your unit economics.
This article traces the direct line from a spike in Brent crude oil prices to the evaporation of net profit margins for mid-market DTC brands, and explains why precision attribution is the only viable defense mechanism.
The Causal Chain: From Hormuz to Your Fulfillment Center
The mechanism by which geopolitical conflict compresses DTC margins is straightforward, but the velocity of the impact in 2026 is unprecedented.
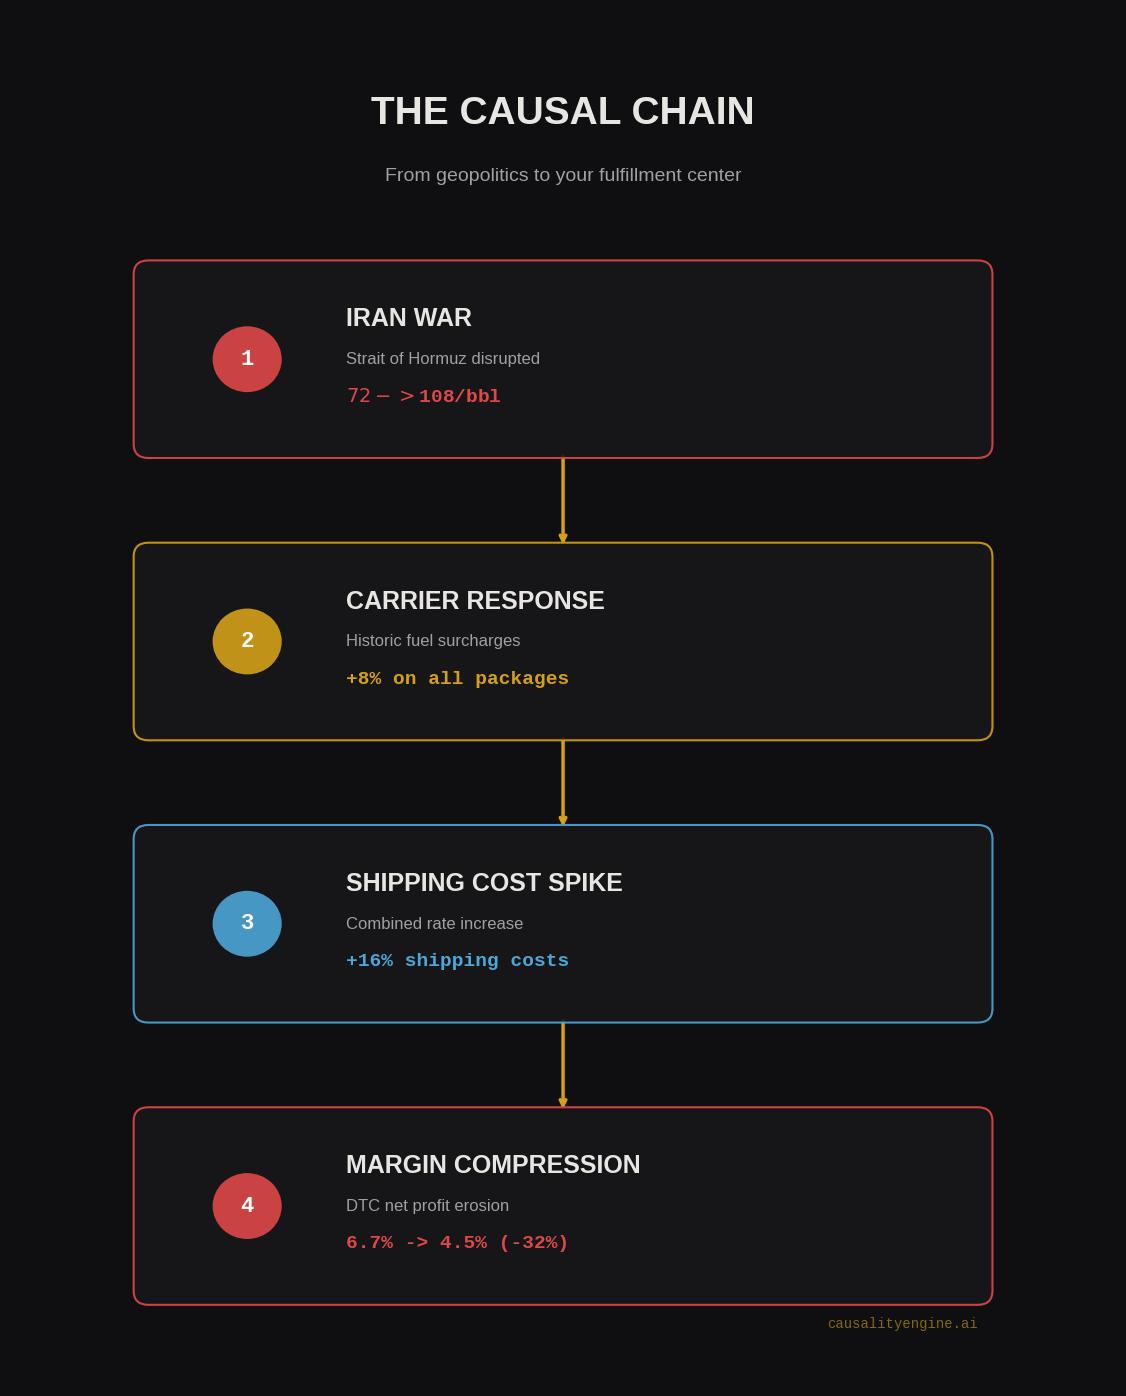
1. The Oil Price Shock
In late February 2026, Brent crude oil hovered around a manageable $72 to $75 per barrel [1]. Following the onset of the US-Israel conflict with Iran and the subsequent disruptions in the Strait of Hormuz, prices spiked violently. By late March, Brent crude had surged past $100, reaching $107.81 per barrel, an increase of nearly 60% in a matter of weeks [2]. The International Energy Agency immediately cut its global oil consumption forecast by 210 kb/d, reflecting the severity of the supply shock [3].
_ea6853ad.png)
2. The Carrier Response
Logistics networks cannot absorb a 60% increase in fuel costs. The response from carriers was swift and historic. The United States Postal Service (USPS), whose delivery fleet relies heavily on gasoline, announced its first-ever 8% temporary fuel surcharge on core e-commerce packages, effective April 26, 2026, through January 17, 2027 [4].
This 8% surcharge applies to USPS Ground Advantage, Priority Mail, and Parcel Select [4]. It comes on the heels of a 7.8% general rate increase already implemented earlier in the year. Private carriers mirrored the move; UPS increased its domestic express and ground fuel surcharge on March 9 [5], while residential delivery surcharges across the board pushed per-package fees into the mid-$6 range [6].
3. The DTC Margin Compression
For a mid-market DTC brand (doing $10M to $50M in revenue), the median net profit margin in 2026 sits precariously between 3% and 10% [7]. This is the "messy middle" cohort, already squeezed by rising customer acquisition costs (CAC) and fixed operational expenses.
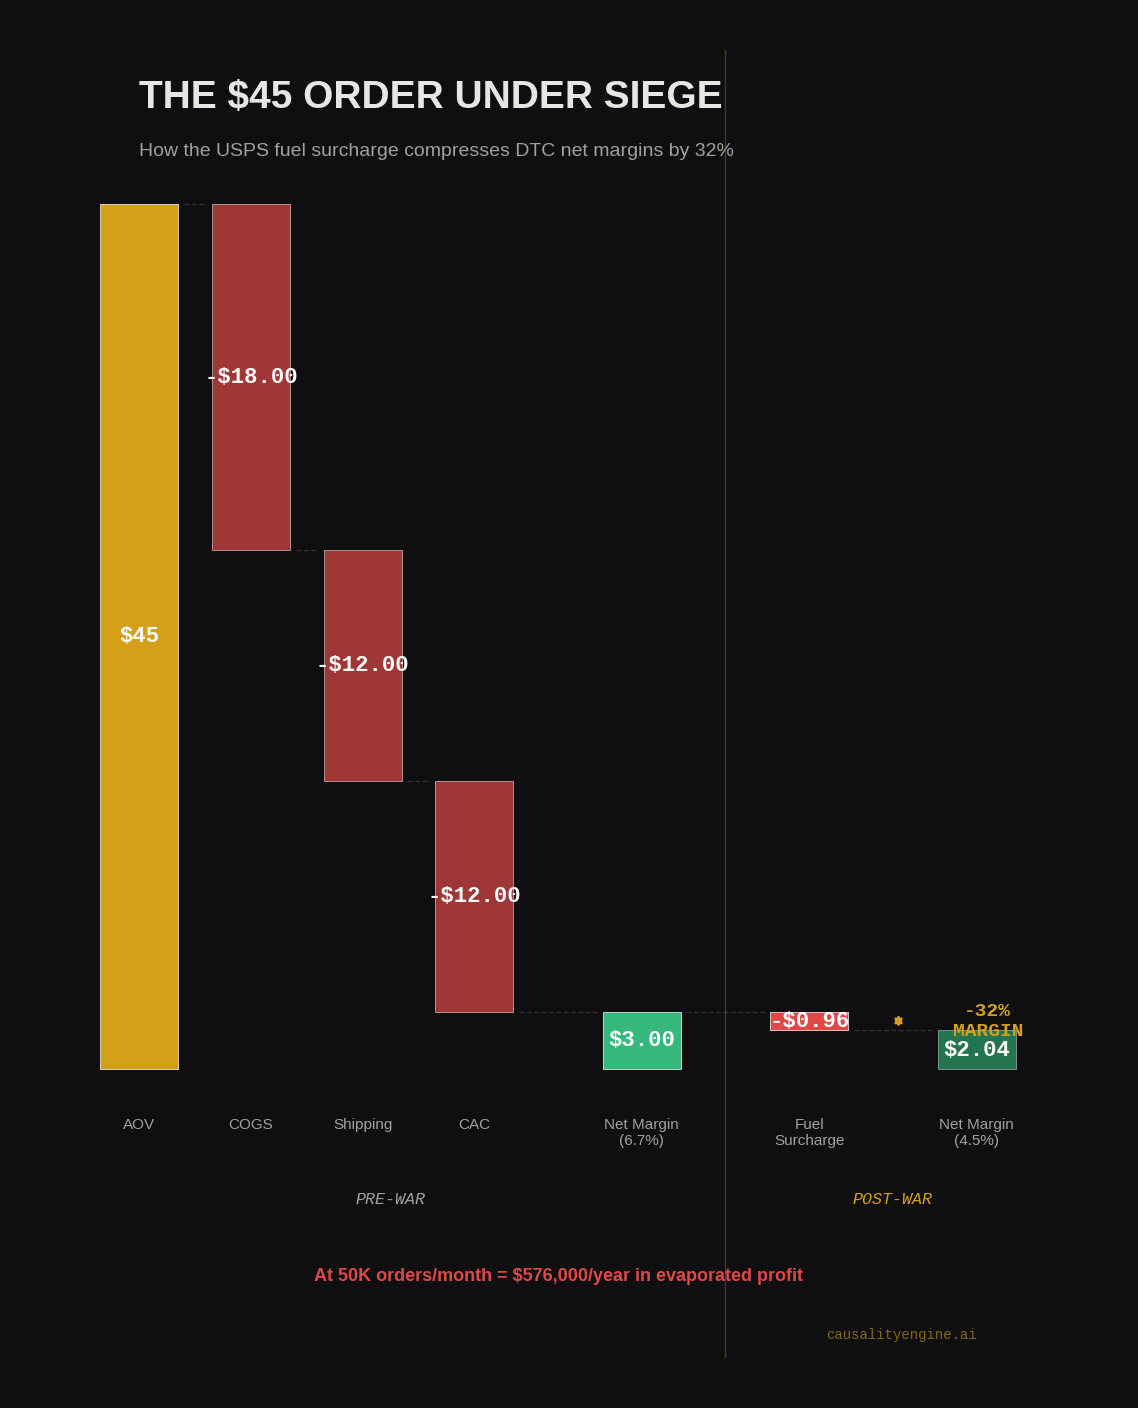
Consider the math for a brand with an Average Order Value (AOV) of $45:
Pre-War: $45 AOV - $18 COGS - $12 Shipping - $12 CAC = $3.00 Net Margin (6.7%)
Post-Surcharge: $45 AOV - $18 COGS - $12.96 Shipping - $12 CAC = $2.04 Net Margin (4.5%)
A seemingly small $0.96 increase in shipping costs compresses the net margin by 32%. For a brand shipping 50,000 orders a month, that is $48,000 in evaporated monthly profit, or over half a million dollars annualized, erased by a single policy change.
The UK retailer NEXT has already publicly accounted for a GBP 15 million cost hit arising directly from the conflict's impact on fuel and freight [8]. The pain is universal, but for DTC brands operating on thin margins, it is existential.
The Illusion of Control and the Attribution Trap
When a macro event compresses your margins by 32% overnight, you cannot control the price of oil. You cannot negotiate away a USPS federal surcharge. You cannot meaningfully lower your COGS without a lengthy supply chain overhaul, and raising prices in an inflationary environment risks destroying your conversion rate.
The only variable you control is your Customer Acquisition Cost (CAC).
However, controlling CAC requires measuring it accurately. If you are relying on platform-reported Return on Ad Spend (ROAS) from Meta or Google, you are navigating a crisis with a broken compass. Advertising platforms are designed to claim maximum credit for every conversion. They operate on correlational attribution models (like last-click or view-through windows) that routinely overstate performance by 20% to 40%.
When your margin was 15%, you could afford the luxury of inaccurate attribution. You could buy revenue at a slight loss and let organic sales cover the spread. When your margin is 4.5%, a 20% error in your CAC calculation means you are actively burning cash on every order. You think you are growing; you are actually financing the illusion of growth.
The Causal Mandate
The era of growth at all costs is definitively over. In a high-friction macroeconomic environment, efficiency is not a tactic; it is the core business strategy.
To survive the geopolitical tax on the last mile, DTC brands must shift from correlational guessing to causal knowing. Causal inference models do not ask, "Did a customer see an ad before buying?" They ask, "Would this customer have bought if they had not seen the ad?"
By isolating the true incremental lift of every marketing dollar, causal inference identifies the exact campaigns that are generating net-new revenue and exposes the spend that is merely cannibalizing organic sales. Eliminating that wasted spend is the fastest, most mathematically sound way to recover the margin lost to the USPS surcharge.
The geopolitical landscape will remain volatile. The cost of fulfillment will remain elevated. The only way to build a resilient e-commerce business is to anchor your growth strategy on math that tells the truth.
Stop guessing, start knowing.
References
[1] U.S. Energy Information Administration. (2026). Cushing, OK WTI Spot Price FOB.
[2] Fortune. (2026). Current price of oil as of March 27, 2026.
[3] International Energy Agency. (2026). Oil Market Report, March 2026.
[4] DCL Logistics. (2026). Navigating the USPS 8% Fuel Surcharge.
[5] Transportation Insight. (2026). How Fuel Surcharges Quietly Raise Parcel Shipping Costs.
[6] ShipperHQ. (2026). 2026 Carrier Rate Increases: What Shippers Need to Know.
[7] Luca AI. (2026). Ecommerce Profit Margins for DTC Operators.
[8] The Industry Beauty. (2026). NEXT reveals GBP 15 million cost hit from Iran war.
Get attribution insights in your inbox
One email per week. No spam. Unsubscribe anytime.
Key Terms in This Article
Average Order Value (AOV)
Average Order Value (AOV) is the average amount of money each customer spends per transaction. Causal analysis determines which marketing efforts increase AOV.
Causal Inference
Causal Inference determines the independent, actual effect of a phenomenon within a system, identifying true cause-and-effect relationships.
Conversion rate
Conversion Rate is the percentage of website visitors who complete a desired action out of the total number of visitors.
Customer acquisition
Customer acquisition attracts new customers to a business. For e-commerce, this means driving the right traffic to the website.
Customer Acquisition Cost (CAC)
Customer Acquisition Cost (CAC) is the cost to convince a consumer to buy a product or service. It measures marketing campaign effectiveness.
Incrementality
Incrementality measures the true causal impact of a marketing campaign. It quantifies the additional conversions or revenue directly from that activity.
Profit Margin
Profit margin measures profitability, calculated as net income divided by revenue and expressed as a percentage.
Return on Ad Spend (ROAS)
Return on Ad Spend (ROAS) measures the revenue earned for every dollar spent on advertising. It indicates the profitability of advertising campaigns.
Related Articles
Ready to see your real numbers?
Upload your GA4 data. See which channels drive incremental sales. Confidence-scored results in minutes.
Book a DemoFull refund if you don't see it.
Stay ahead of the attribution curve
Weekly insights on marketing attribution, incrementality testing, and data-driven growth. Written for marketers who care about real numbers, not vanity metrics.
No spam. Unsubscribe anytime. We respect your data.
Frequently Asked Questions
How does the Iran war affect DTC e-commerce shipping costs?
The US-Israel conflict with Iran disrupted the Strait of Hormuz, driving Brent crude from $73 to $108/barrel (60% increase). USPS responded with its first-ever 8% temporary fuel surcharge on all core e-commerce packages. UPS and other carriers mirrored with their own increases, pushing residential delivery surcharges into the mid-$6 range.
How much does the USPS fuel surcharge compress DTC margins?
For a brand with a $45 AOV, the USPS 8% fuel surcharge adds $0.96 per order, compressing net margins from 6.7% to 4.5%, a 32% reduction. At 50,000 orders/month, that equals $48,000 in evaporated monthly profit, or $576,000 annualized.
Why is attribution accuracy critical when margins are compressed?
When net margins drop to 4.5%, a 20% error in CAC measurement means you are burning cash on every order. Platform-reported ROAS routinely overstates performance by 20-40%. At 15% margins, this was affordable. At 4.5% margins, it is existential. The only controllable variable is CAC, and controlling it requires measuring it accurately.
What is the causal chain from oil prices to DTC margin compression?
The chain runs: (1) Iran war disrupts Strait of Hormuz, Brent crude surges 60% to $108/barrel, (2) Carriers respond with historic fuel surcharges (USPS 8%, UPS increases), (3) Shipping costs spike 16% combined, (4) DTC net margins compress 32% (from 6.7% to 4.5% on a $45 AOV).
How can DTC brands recover margin lost to shipping surcharges?
The fastest path to margin recovery is eliminating wasted ad spend through causal inference measurement. By identifying which campaigns drive truly incremental sales versus those cannibalizing organic revenue, brands can cut the 20-40% of spend that platforms falsely claim credit for. This is more immediate than supply chain overhauls or price increases.